Why Professionals Choose
MyLens AI for Quadrants?
Save Time
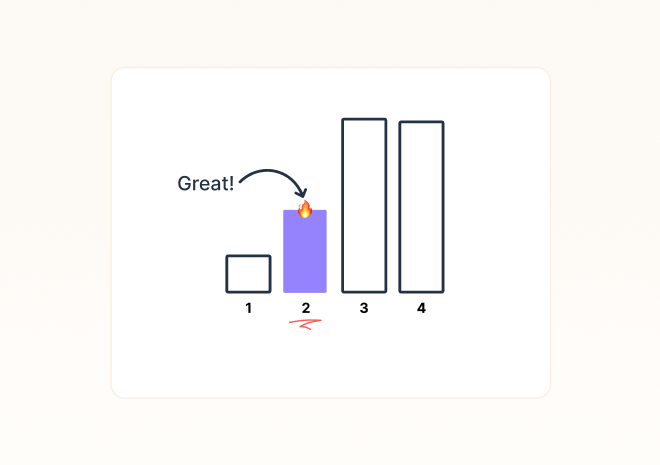
Highlight Key Differences
Engage Your Audience
How It Works
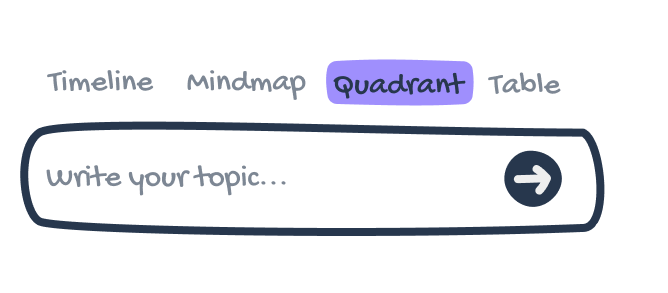
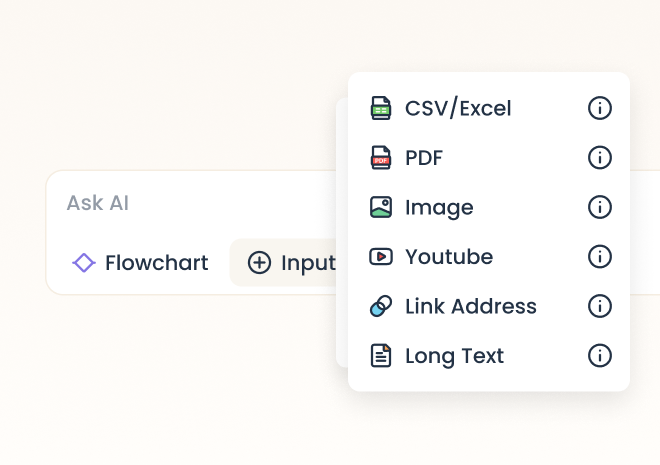
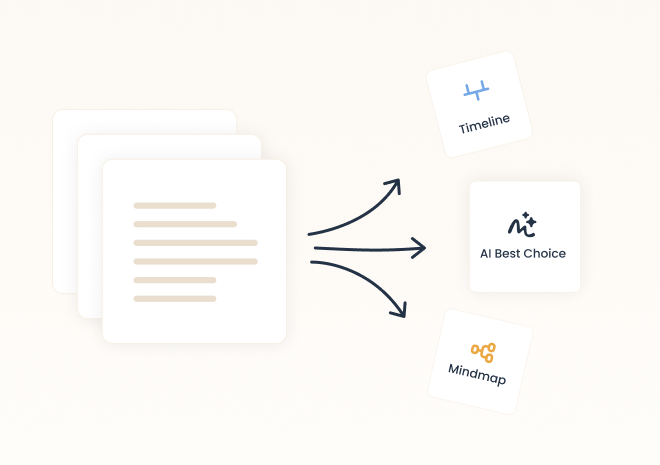
1 - Add Your ContentWrite your ideas or upload your content—from text to PDFs, images, spreadsheets, or reports—and MyLens AI extracts the key factors automatically.
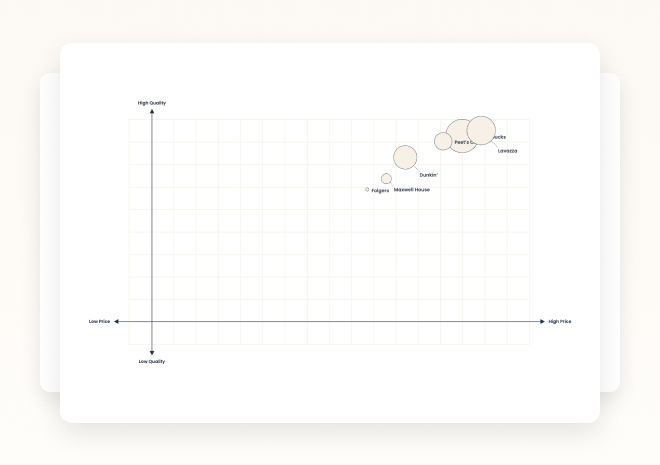
2 - AI Generates Your QuadrantOur AI organizes your data into a clear, visually engaging quadrant, categorizing elements based on relationships, strengths, and differences.
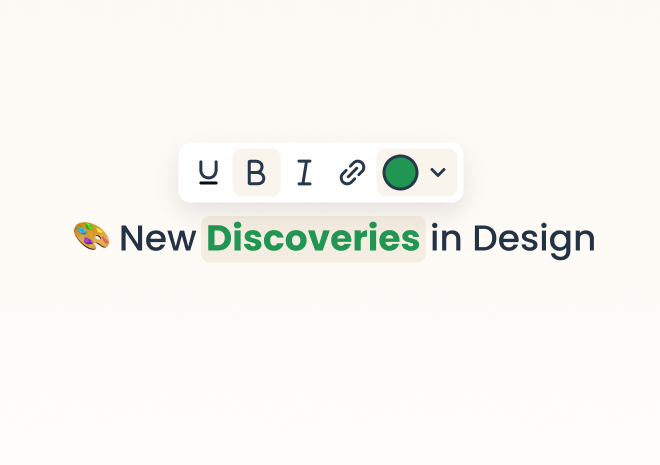
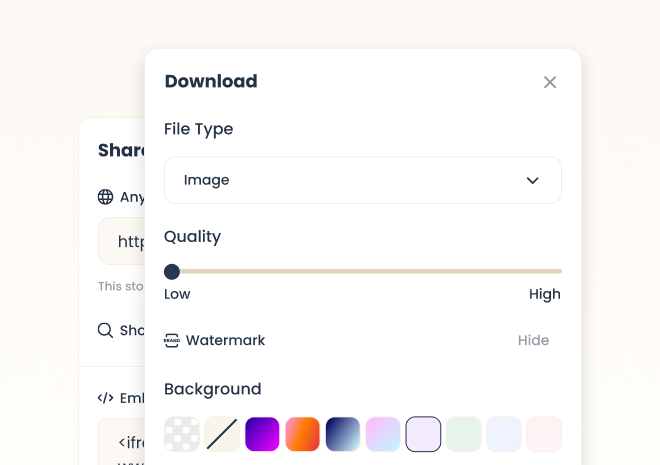
3 - Edit & PersonalizeEasily tweak your quadrant, adjust content or styles, and emphasize critical insights to match your needs.
4 - Share & PresentPresent your interactive quadrant within MyLens or download a high-quality version for reports, presentations, or decision-making.
Who Benefits from
MyLens AI Quadrants?

Business Professionals & ConsultantsCompare strategies, competitors, or opportunities in a structured quadrant to support better decision-making and strategic planning.

Researchers & AnalystsAnalyze market trends, case studies, and survey data in a quadrant format, making insights easier to interpret and act upon.

Marketers & Product ManagersVisualize competitor positioning, brand strategies, or audience segmentation in a clear quadrant to identify gaps and opportunities.

Students & EducatorsTurn comparative studies, research data, or learning materials into structured quadrants that make understanding complex relationships effortless.
What Makes MyLens
Visuals Truly Effective?
Right InformationNot all data are equally important. MyLens AI filters key insights, so your audience grasps what truly matters.

Right VisualDifferent insights require different visuals. MyLens AI selects the best format to match your intent, making your data easy to understand and interpret.
Right MessageColors, styles, and layouts should guide attention—not distract from your key message. MyLens AI applies design principles strategically to keep your visual clear, focused, and impactful.
Use MyLens Quadrants
Anywhere
Presentations & Reports
Research & Data Analysis
Websites & Articles
Marketing & Strategy