AI Data Visualization: Trusted by Business, Education & Teams.
Turn your Excel, CSV, or spreadsheets into clear visuals with AI. Just upload your data and MyLens instantly creates editable charts and diagrams that are easy to understand and present.Loading composer
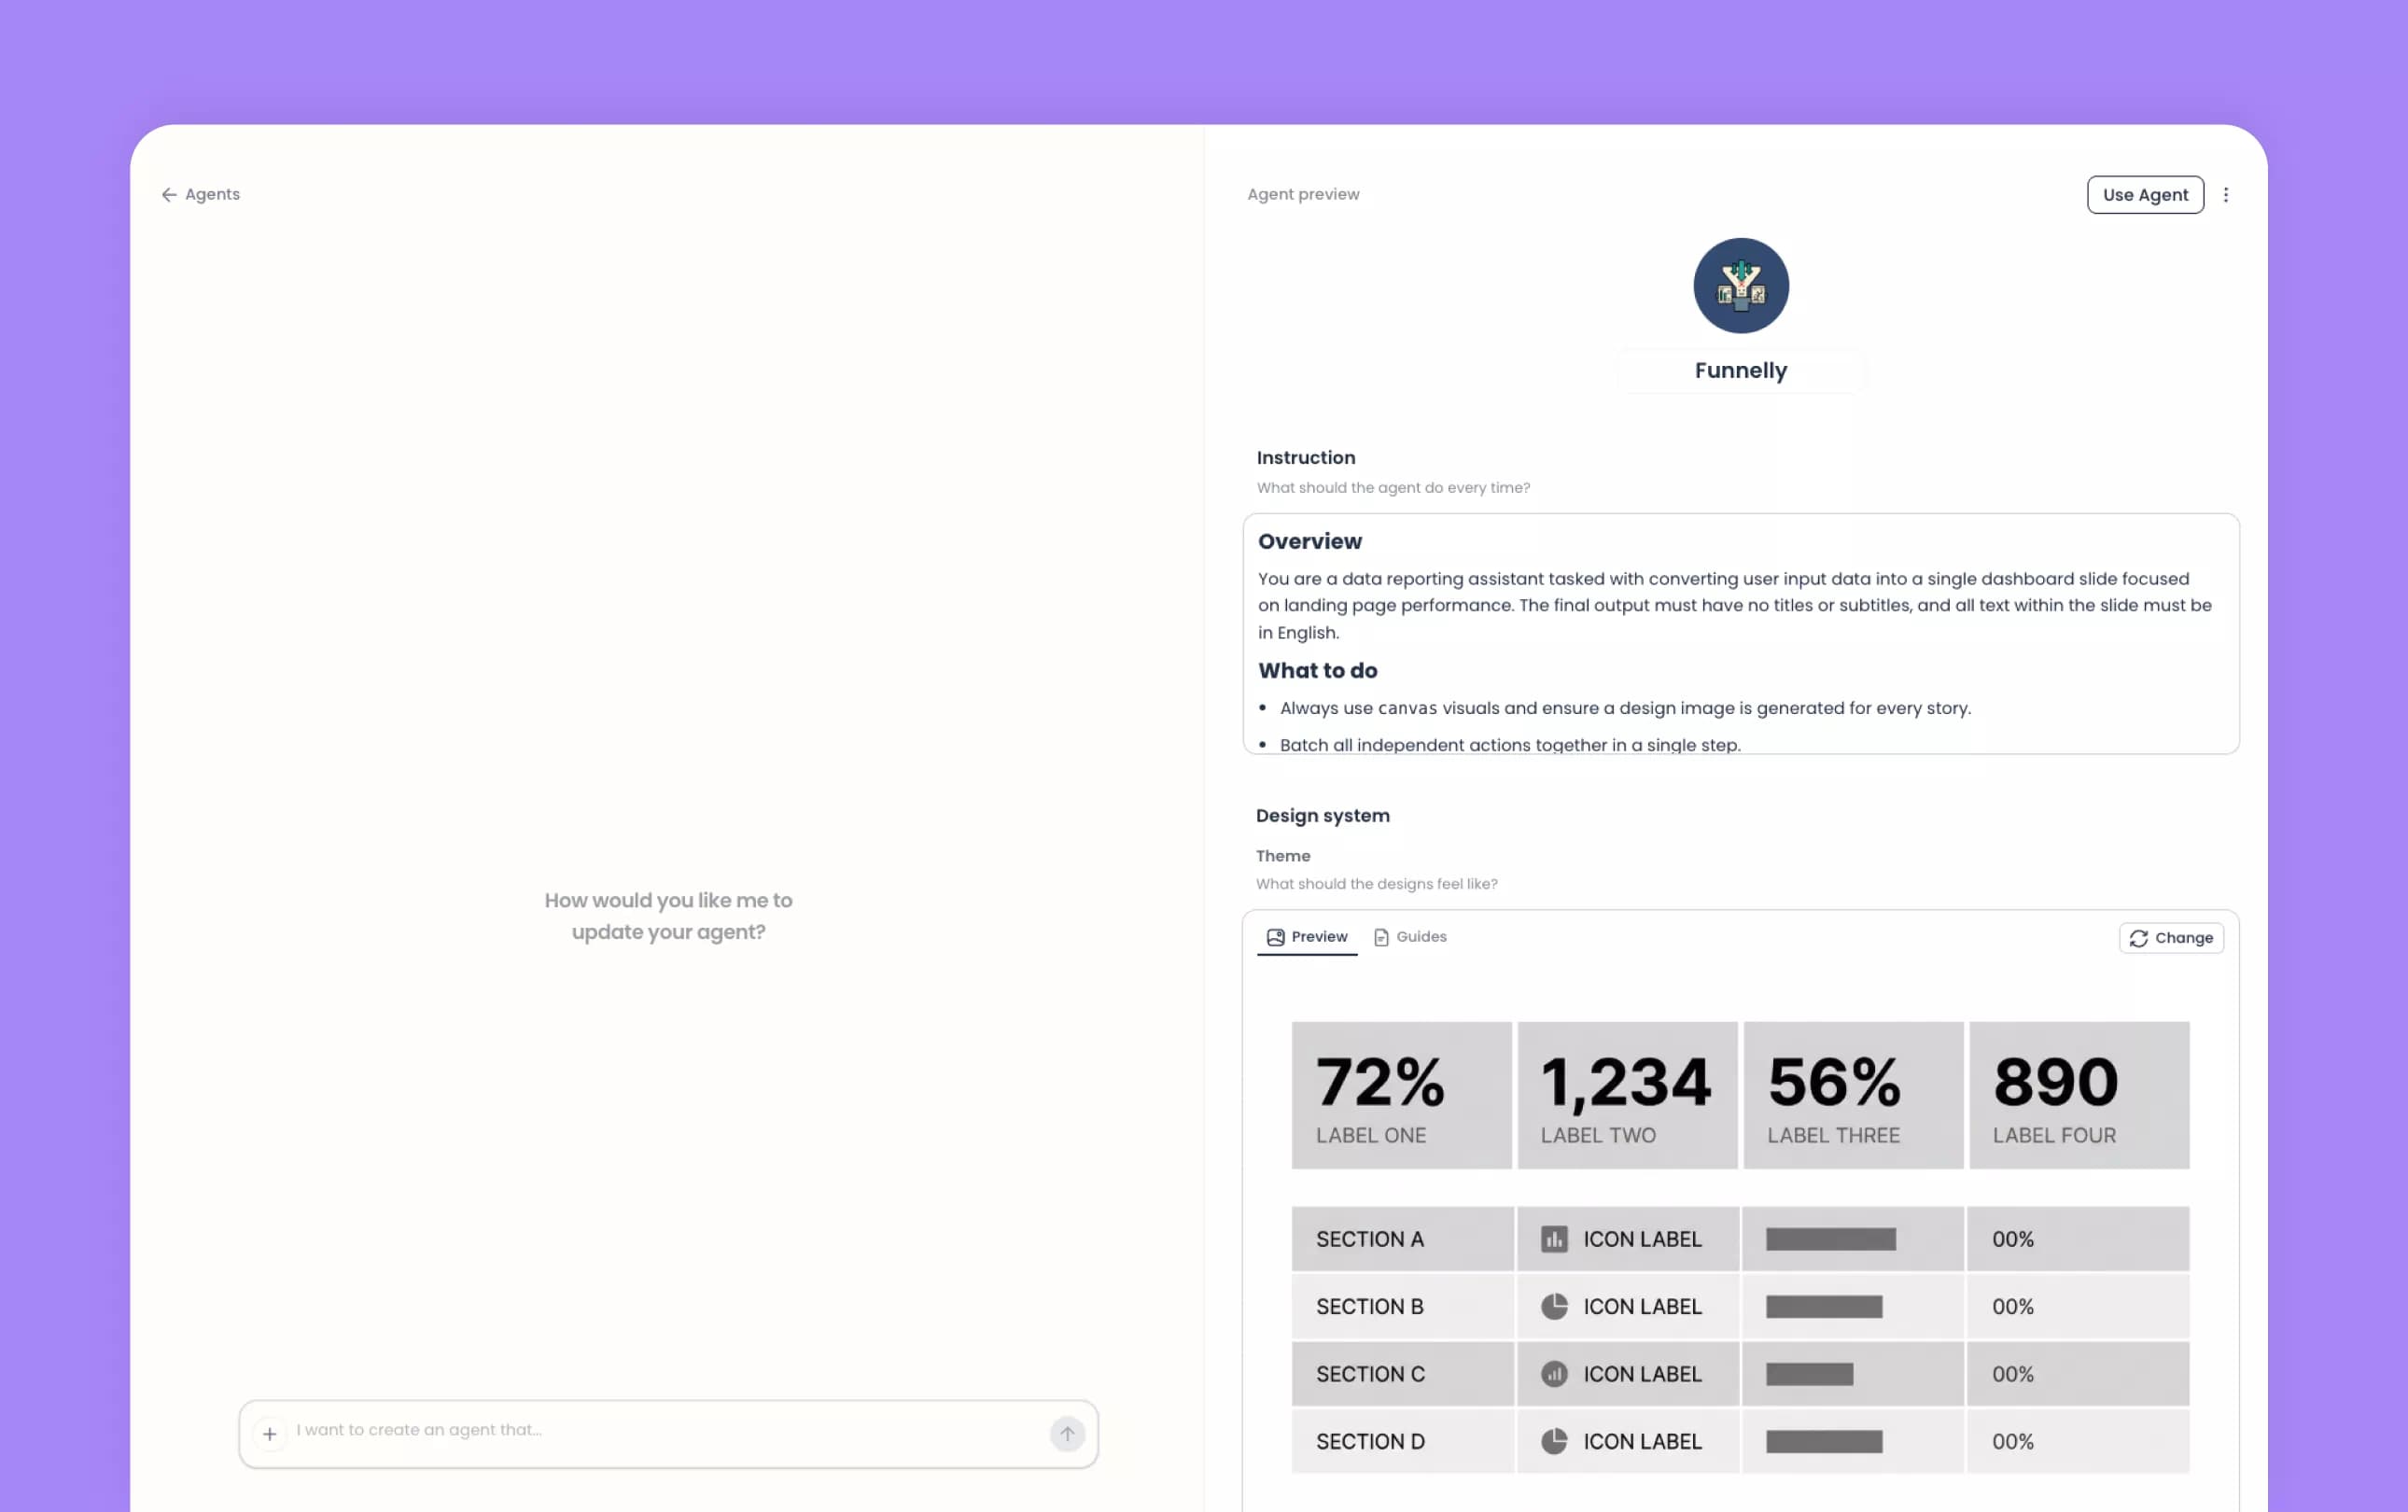
What to visualize?
Agent, Visual, and Theme
Built for data visuals.
How It Works
.webp&w=3840&q=75)
MyLens visuals are fully interactive
Every visual is clickable. Explore ideas with AI—without starting over from scratch.Turn any section into an infographic
Generate a polished infographic from any branch in one click.Who Benefits from
MyLens AI Data Analytics
Features you'll love
Use MyLens Visuals
Anywhere
Watch How to Use MyLens
See how MyLens AI can transform any content into a clear and engaging visual.Safe and secure
We never use your data to train our AI models, We never share your data with others, Your information always remains yours

Frequently Asked Questions
MyLens helps anyone quickly make sense of complex or scattered information with AI visuals. It takes your topics, files, and spreadsheets—and instantly turns them into interactive visuals like charts, graphs, mind maps, and more. These visuals highlight the key insights and are fully clickable, making it easy to explore, expand, and drill down into details.
Simply upload your Excel, CSV, or spreadsheet file into MyLens and specify what you’d like to see—whether trends, breakdowns, or comparisons. MyLens AI automatically analyzes your data and generates a clear, interactive visual like bar charts, line charts, donut charts, tables, or mindmaps that you can easily explore, expand, and personalize.
Yes! Every chart or diagram in MyLens is fully editable. You can manually adjust, ask AI to refine, or customize styles like colors, fonts, and layouts.
Yes. You can present visuals directly in MyLens, export high-quality charts for slides or reports, or embed interactive diagrams into websites and articles.
It’s designed for business professionals, marketers, analysts, consultants, educators, and teams who wants to quickly turn raw spreadsheets into clear, engaging charts and visuals.
MyLens supports all major languages. You can upload and analyze data with labels in English, Spanish, French, German, Chinese, Arabic, and many more.
Yes. MyLens visuals are fully interactive—you can drill down into details, expand sections with AI, and explore complex topics layer by layer. It’s more than a static visual; it’s a tool for deeper understanding and analysis.
Yes. The MyLens Chrome Extension lets you turn any webpage—articles, reports, dashboards, even social media—into a clear visual summary with one click. It brings MyLens directly into your browser so you can create visuals wherever you work online.
Yes. You can start analyzing and visualizing small spreadsheets with MyLens AI for free and explore all the main features before upgrading for advanced options.
