Why Professionals Choose MyLens AI
for Spreadsheet Analytics
Save Time
Focus on Key Insights
Engage Your Audience
How It Works
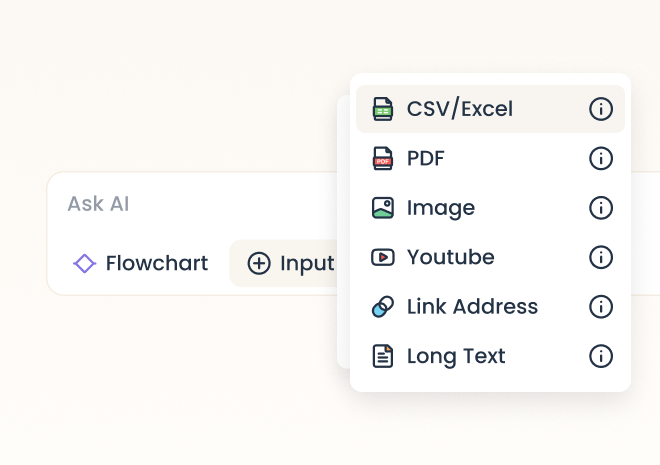
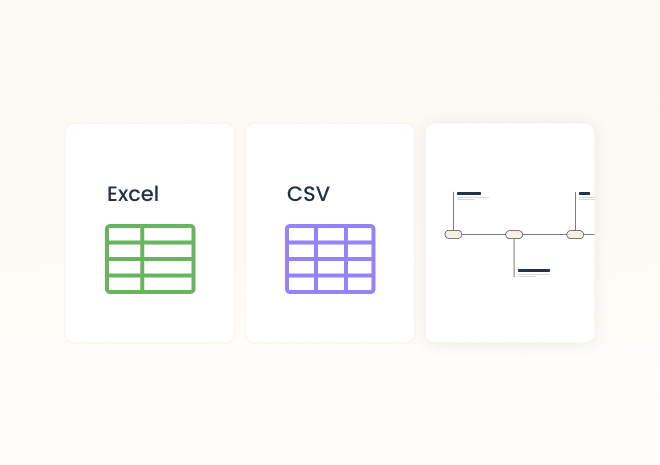
1 - Upload Any CSV or Excel FileAdd your file to MyLens AI and specify the insights or questions you want answered.
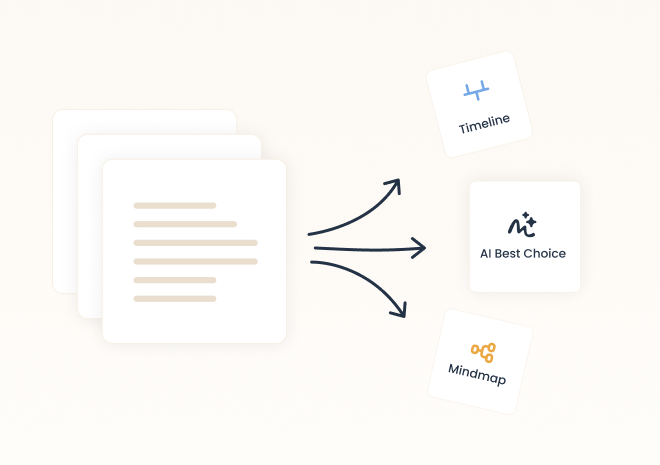
2 - AI Processes & VisualizesEasily tweak your visual, adjust content or styles, and emphasize critical points to match your needs.
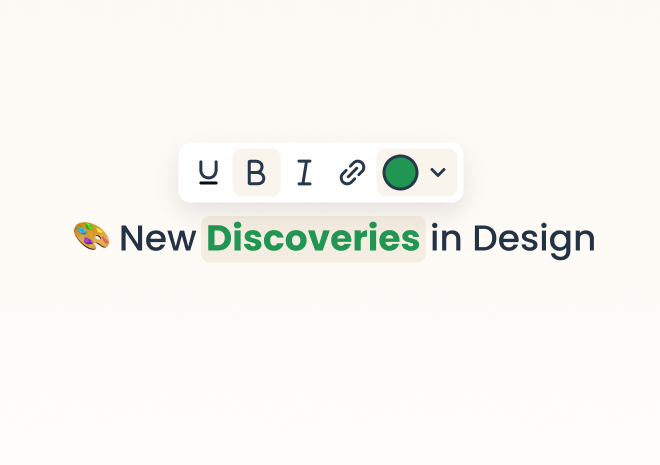
3 - Edit & PersonalizeEasily tweak your flowchart, adjust content or styles, to fit your unique needs and style.
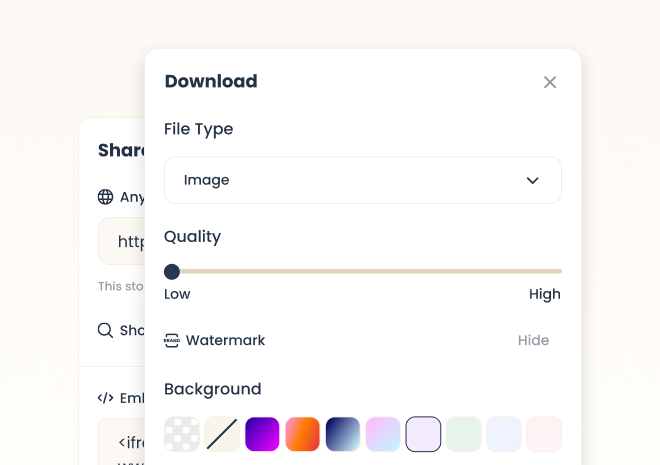
4 - Share & PresentPresent your interactive visual within MyLens or download a high-quality version for collaboration, reports, or presentations.
Who Benefits from
MyLens AI Data Analytics

Business ProfessionalsTransform spreadsheets into easy-to-read insights. Make everyday decisions and presentations clearer with quick visual summaries.

MarketersHighlight top-level campaign metrics or basic customer data. Share streamlined charts and summaries for a more focused strategy discussion.

Analysts & ResearchersGet an overview of datasets. Quickly spot trends and share visual snapshots without diving into complex formulas.

ConsultantsPresent concise, data-backed recommendations to clients. Turn raw files into neat visuals, supporting faster understanding and decision-making.
What Makes MyLens
Visuals Truly Effective?
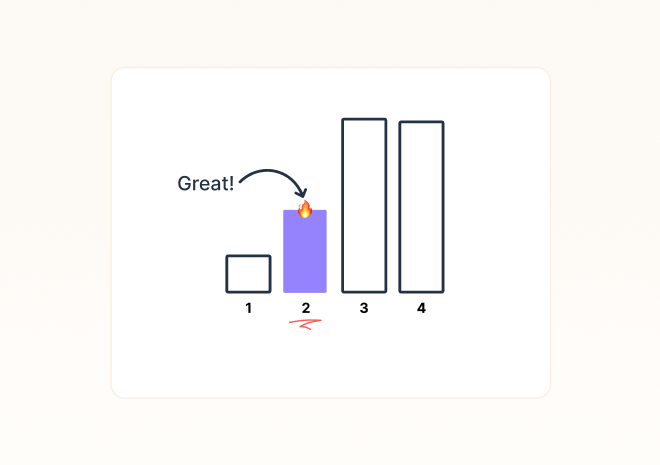
Right InformationNot all data are equally important. MyLens AI filters key insights, so your audience grasps what truly matters.
Right VisualDifferent insights require different visuals. MyLens AI selects the best format to match your intent, making your data easy to understand and interpret.
Right MessageColors, styles, and layouts should guide attention—not distract from your key message. MyLens AI applies design principles strategically to keep your visual clear, focused, and impactful.
Use MyLens Visuals
Anywhere
Presentations & Reports
Research & Reports
Websites & Articles
Collaboration & Brainstorming

Your Data is Secure with MyLens
No Data TrainingYour data is used only to create your visual, never for training our AI. Your privacy and data security are our top priorities.