Why Professionals Choose
MyLens AI for Tree Plots?
How It Works
Add Your Content

AI Generates Your Tree

Edit & Personalize

Share & Present

Who Benefits from
MyLens AI Tree Plots?
Use MyLens Tree Plots
Anywhere
We Respect Your Privacy
We never use your data to train our AI models
We never share your data with others
Your information always remains yours
Frequently Asked Questions
MyLens helps anyone quickly make sense of complex or scattered information with AI visuals. It takes your topics, files, and sources—and instantly turns them into interactive visuals like tree diagrams, timelines, mind maps, quadrants, and more. These visuals show the key insights and are fully clickable, making it easy to explore, expand, and drill down into details.
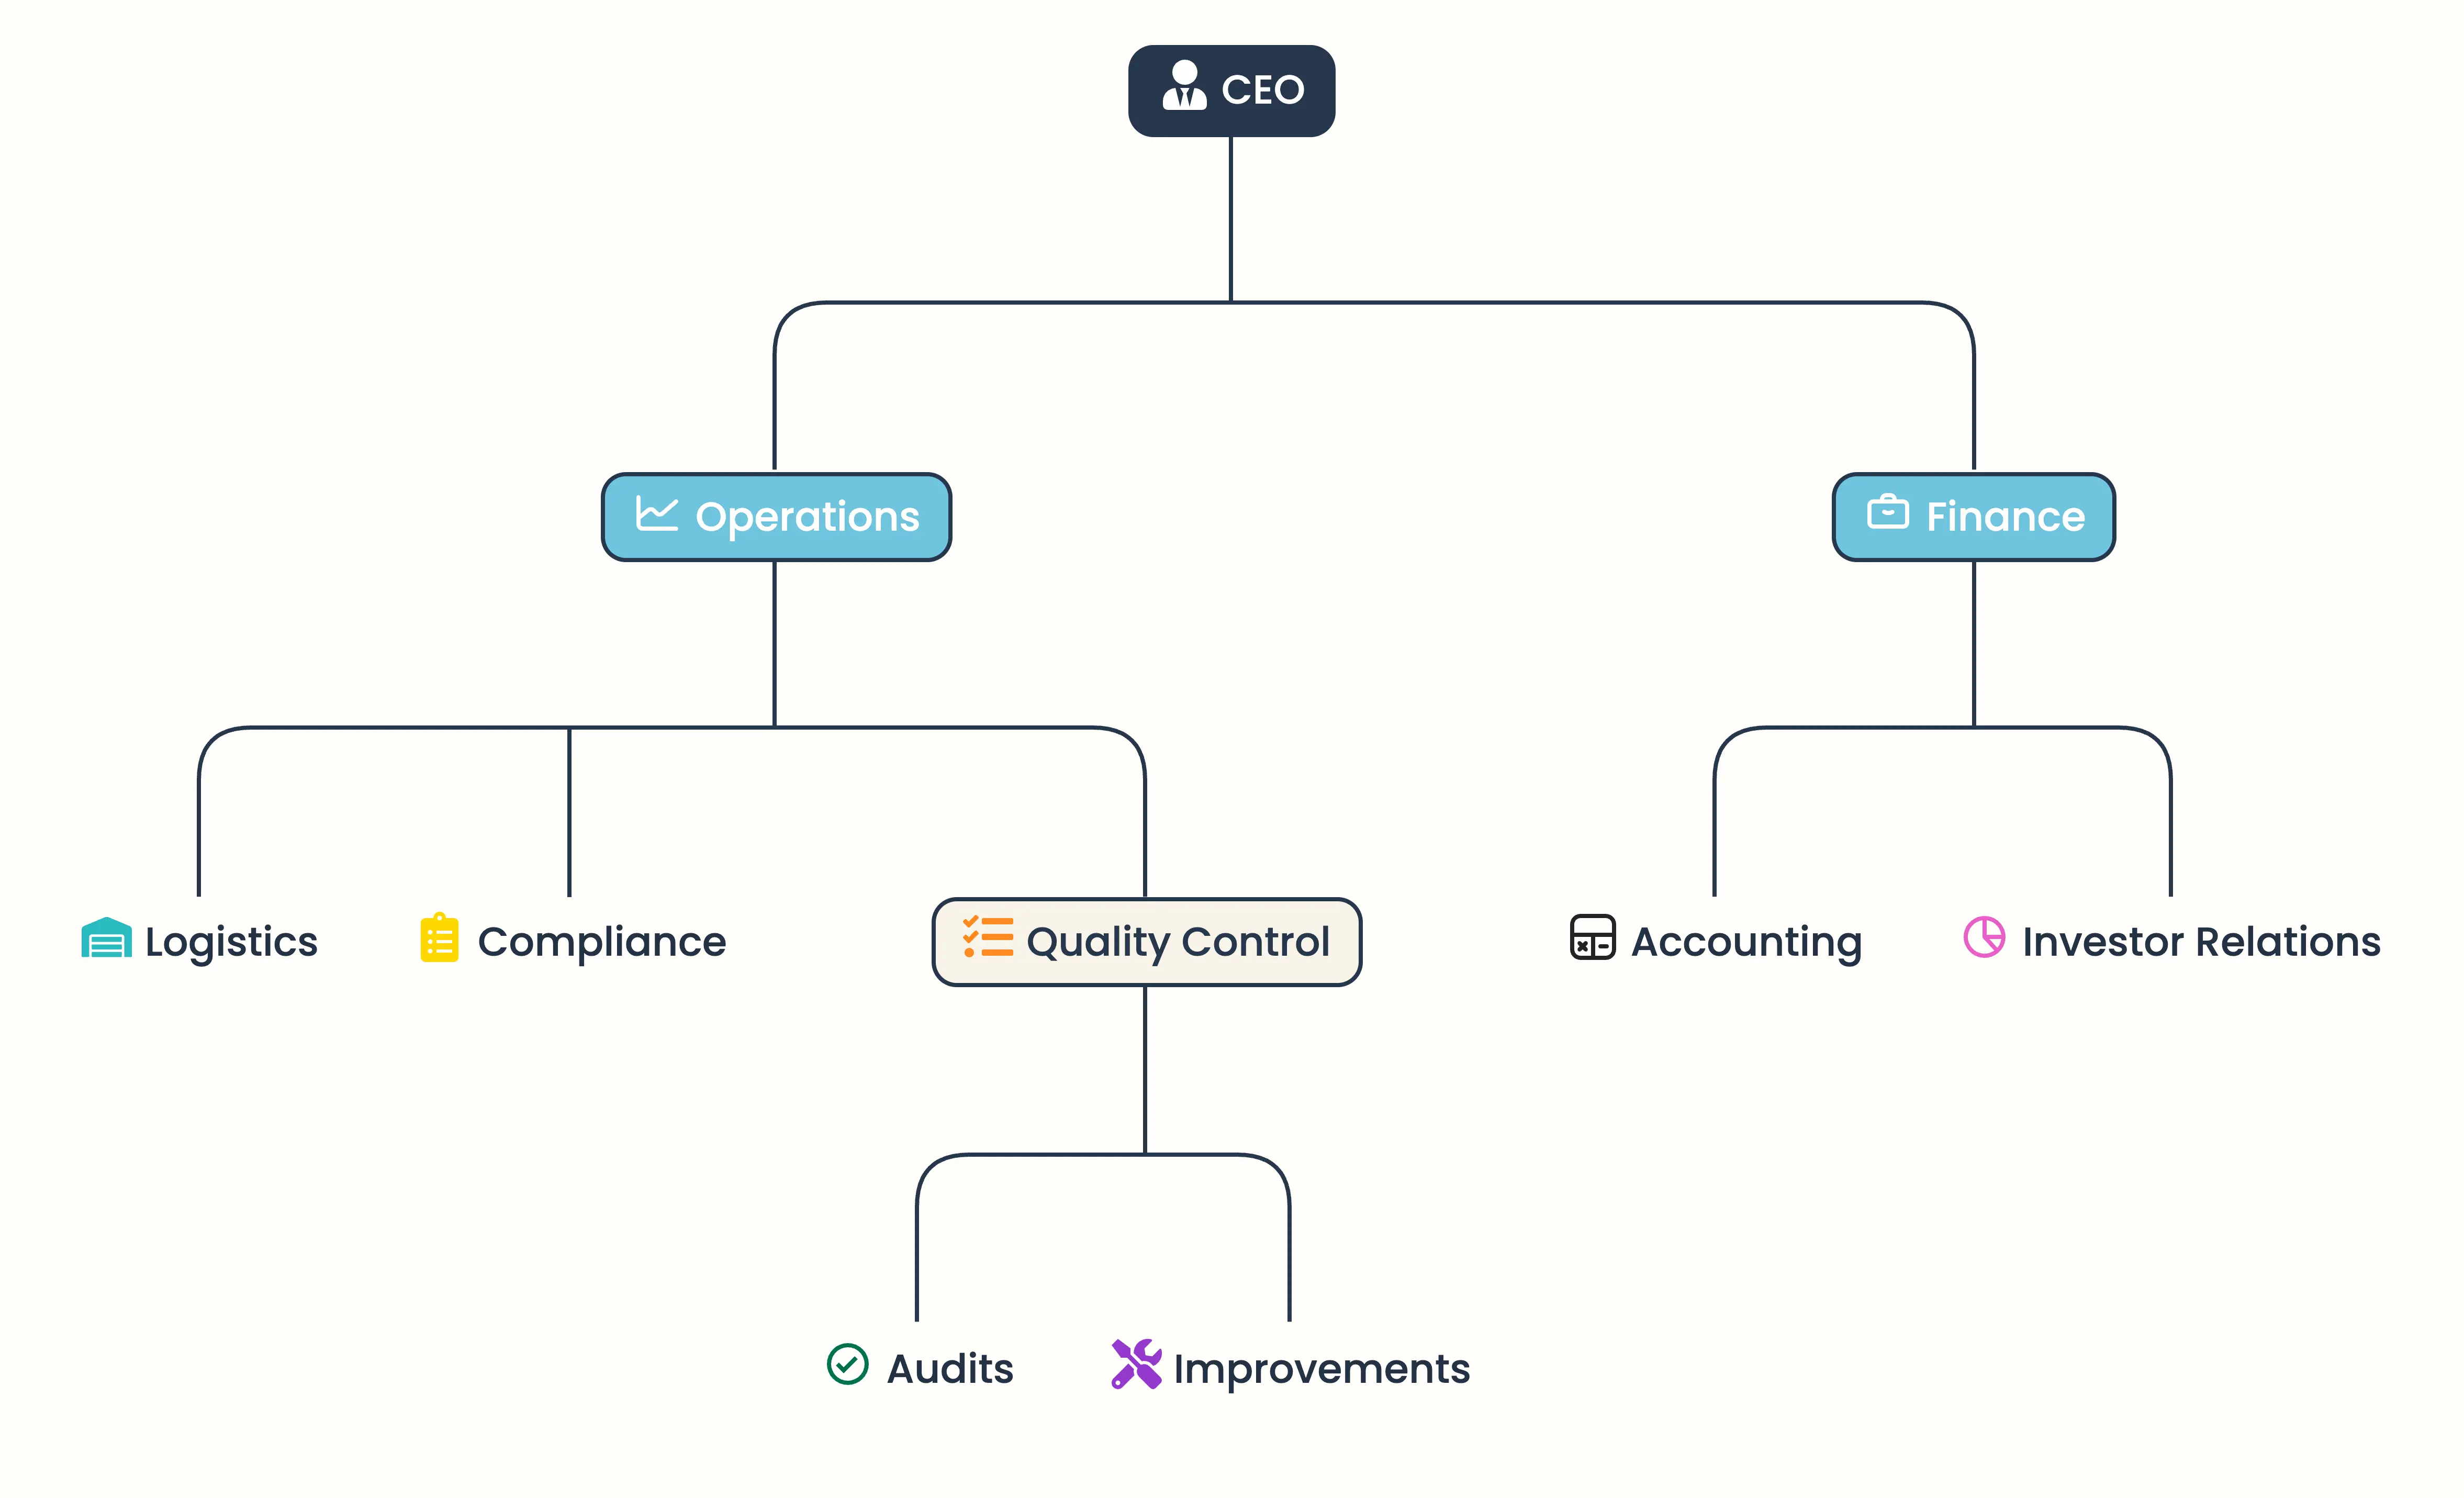
Simply type a topic or add your sources—such as text, PDFs, Word docs, spreadsheets, URLs, images, or YouTube videos. MyLens AI automatically extracts the structure and organizes it into a tree diagram you can explore, expand, and personalize to fit your needs.
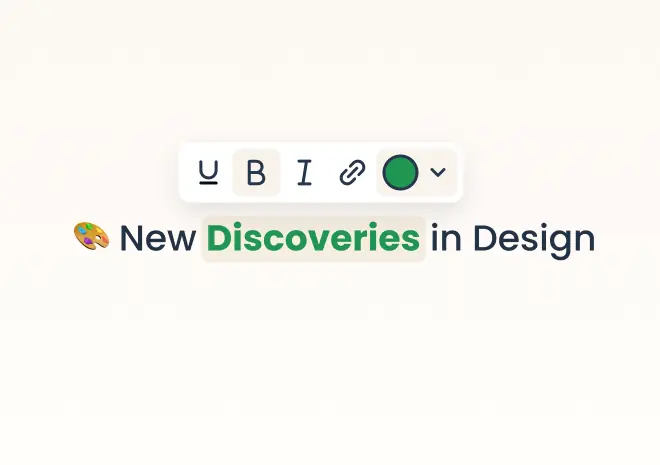
Yes! Every tree in MyLens is fully editable. You can manually adjust nodes, ask AI to refine them, and customize styles like colors, fonts, and layouts to fit your needs.
Yes. You can present tree diagrams directly in MyLens, download high-quality visuals for PowerPoint, reports, or PDFs, or embed interactive tree structures into websites and articles.
It’s designed for managers, educators, researchers, students, and teams who want to quickly visualize hierarchies, org charts, decision trees, or branching models in a clear and interactive way.
MyLens supports all major languages. You can create tree diagrams from content in English, Spanish, French, German, Chinese, Arabic, and many more.
Yes. MyLens trees are fully interactive—you can drill down into details, expand sections with AI, and explore complex topics layer by layer. It’s more than a static visual; it’s a tool for deeper understanding and analysis.
Yes. The MyLens Chrome Extension lets you turn any webpage—articles, reports, Notion pages, dashboards, even social media—into a clear visual summary with one click. It brings MyLens directly into your browser so you can create visuals wherever you work online.
Yes. You can start creating tree diagrams with MyLens AI for free and explore the key features before upgrading for advanced options.
