



Decision Meetings
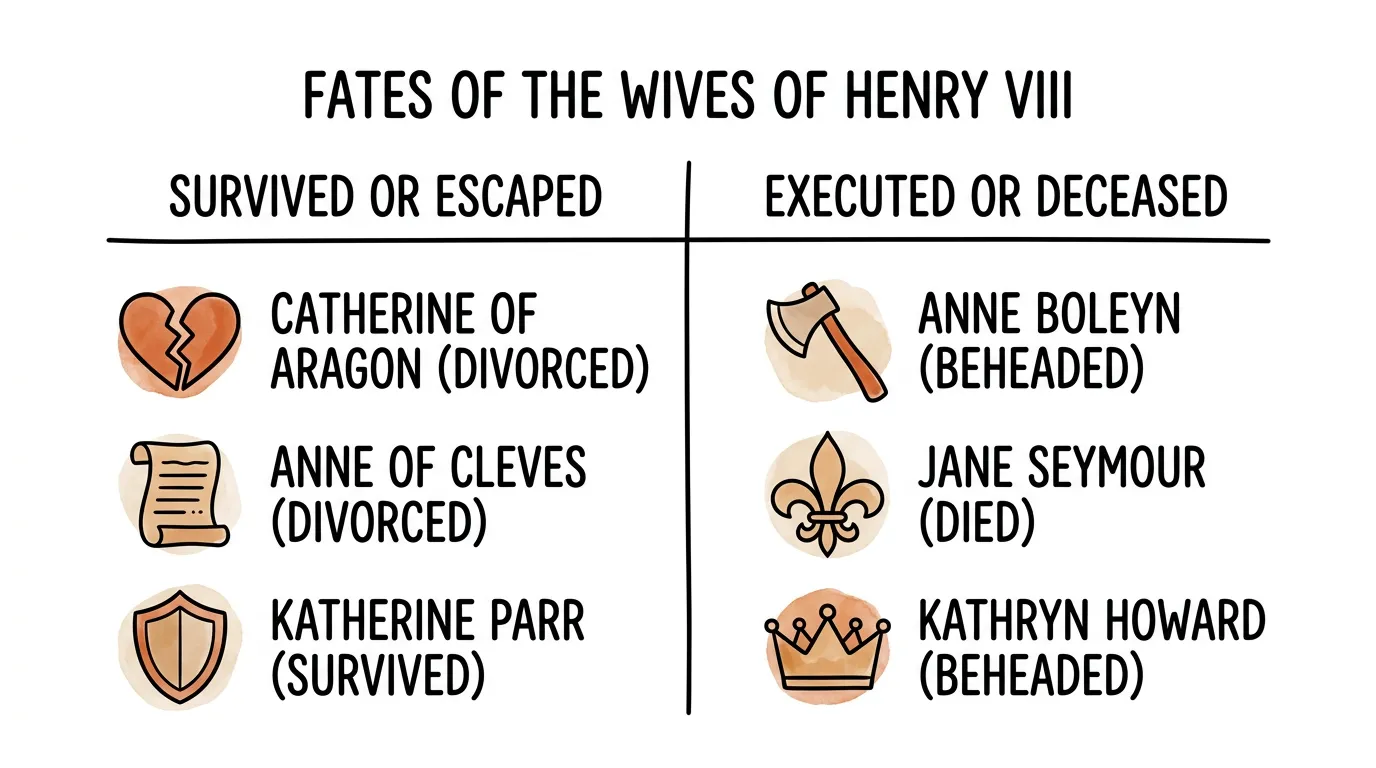
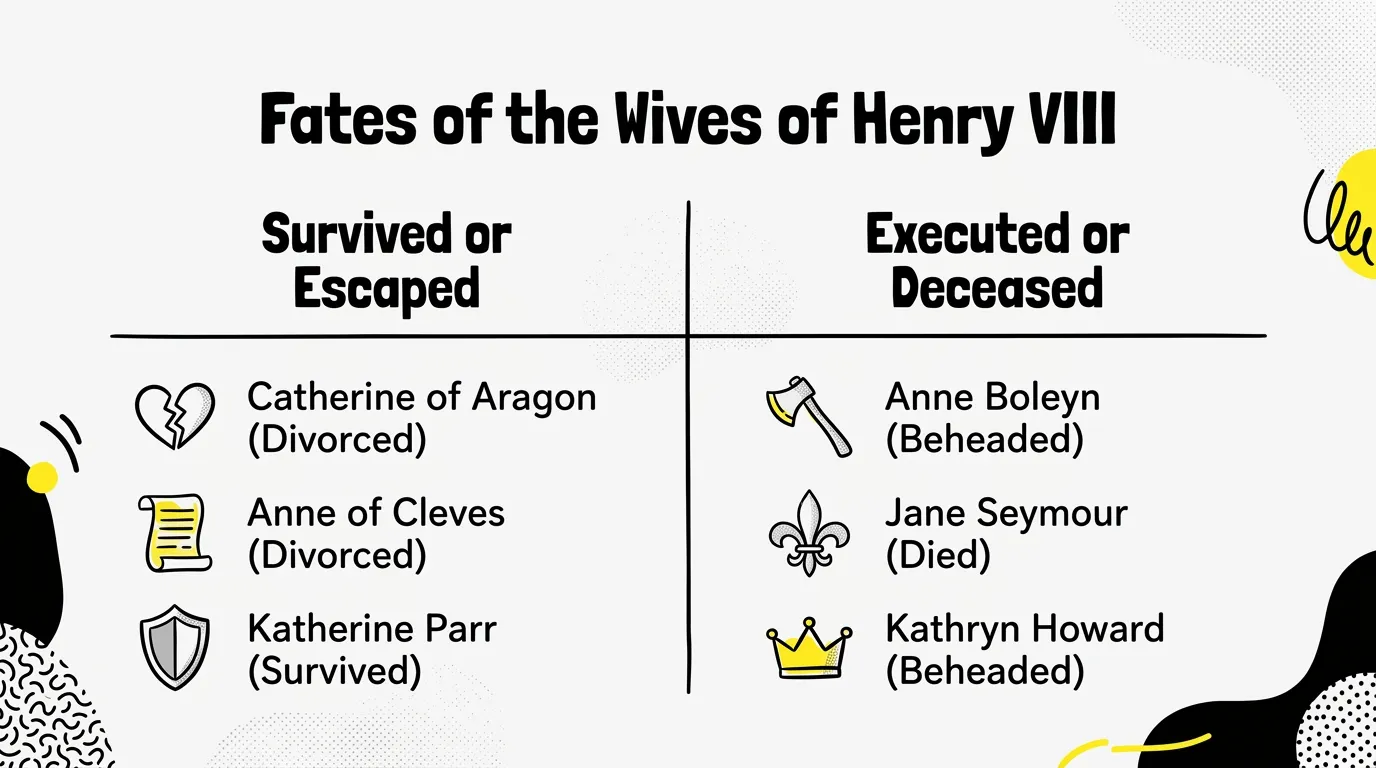
Put both sides on one visual so the room debates substance, not formatting Ready to present.Create Balanced AI T-Charts
Drop pros and cons onto one clear page, then open a point to pressure-test it.
Switch unlimited themes when you present the debate to a team or class.
Loading composer
What to visualize?
Same visual. Endless theme looks.
Switch colors, typography, and layout in one click—pick the style that fits your audience.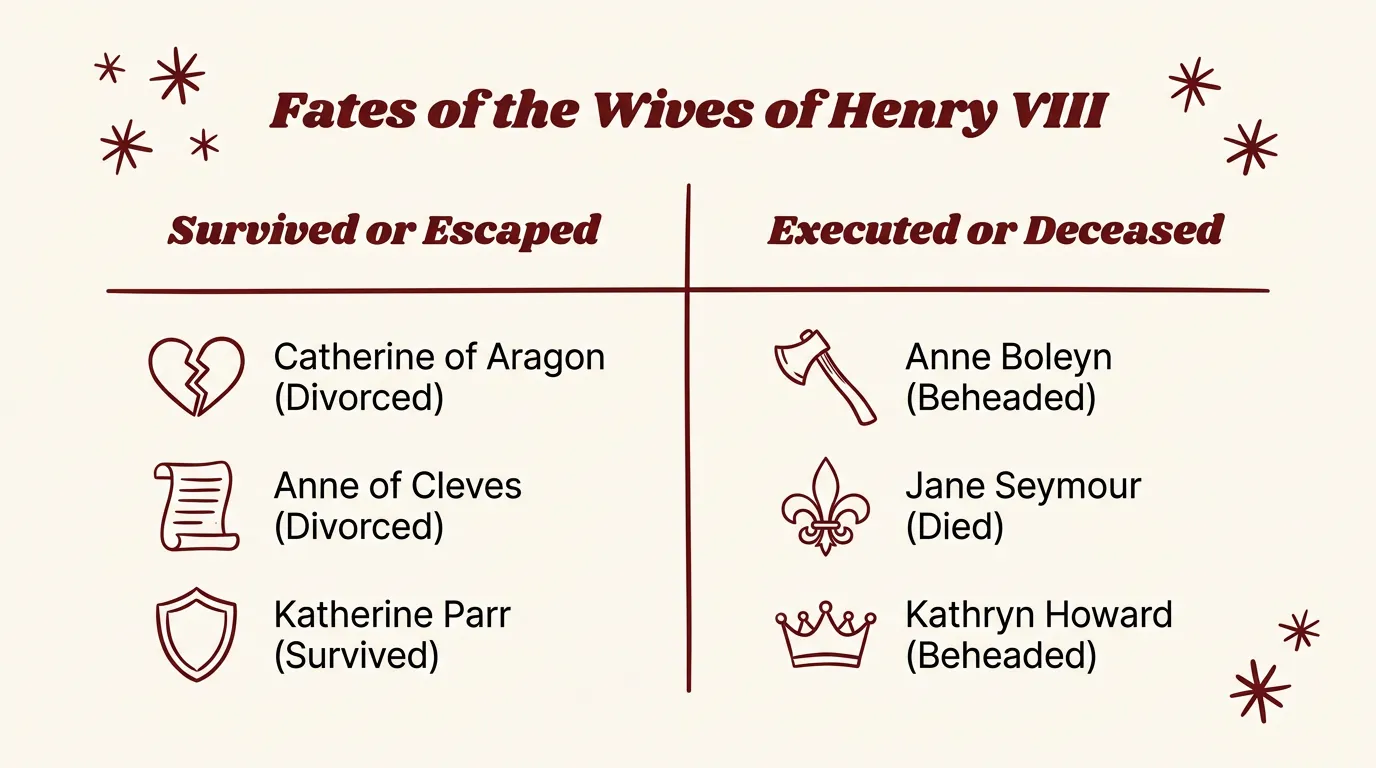
Hear Your Visual Come Alive
One click turns a silent diagram into a guided walkthrough—AI narrates the story while you keep exploring every clickable part.How It Works
Use T-Charts Anywhere
Memos & One-pagers
Export a clean T-Chart into docs that summarize trade-offs for leadership.Workshops & Retros
Capture opposing views clearly and refine points as the discussion unfolds.Teaching & Study
Help learners structure arguments with a clear two-column comparison.Safe and secure
We never use your data to train our AI models, We never share your data with others, Your information always remains yours

Questions & Answers
An AI Opposing T-Chart generator turns notes or documents into a T-shaped comparison of two opposing categories with balanced points on each side.
Describe the comparison or upload a source in the magic box. MyLens locks to the Opposing T-Chart visual, builds a Canvas diagram that follows the guide, and lets you edit it, use AI visual actions, and present it.
MyLens T-Charts include AI visual actions—not just a flat export. Use Explain, Cite, or Expand on the visual—and the layout follows a dedicated Opposing T-Chart guide.
Yes. Paste notes or upload docs and MyLens extracts the two sides and supporting points.
Yes. Export from MyLens in formats such as PNG, PDF, and PowerPoint for memos and presentations.
Yes. MyLens lets you create Opposing T-Charts for free so you can try the full MyLens experience before upgrading.
Yes. Explore more visuals from the Visuals hub, including Sankey Flow, Timeline, Mind Map, and more.