



Board Decks & Meetings
Drop a clear flow diagram into slides so budgets and pipelines need less explanation Ready to present.Create Proportional AI Sankey Diagrams
Paste a budget or pipeline—flow width shows quantity, so the biggest splits jump out.
Switch unlimited themes until it looks presentation-ready for your audience.
Loading composer
What to visualize?
Same visual. Endless theme looks.
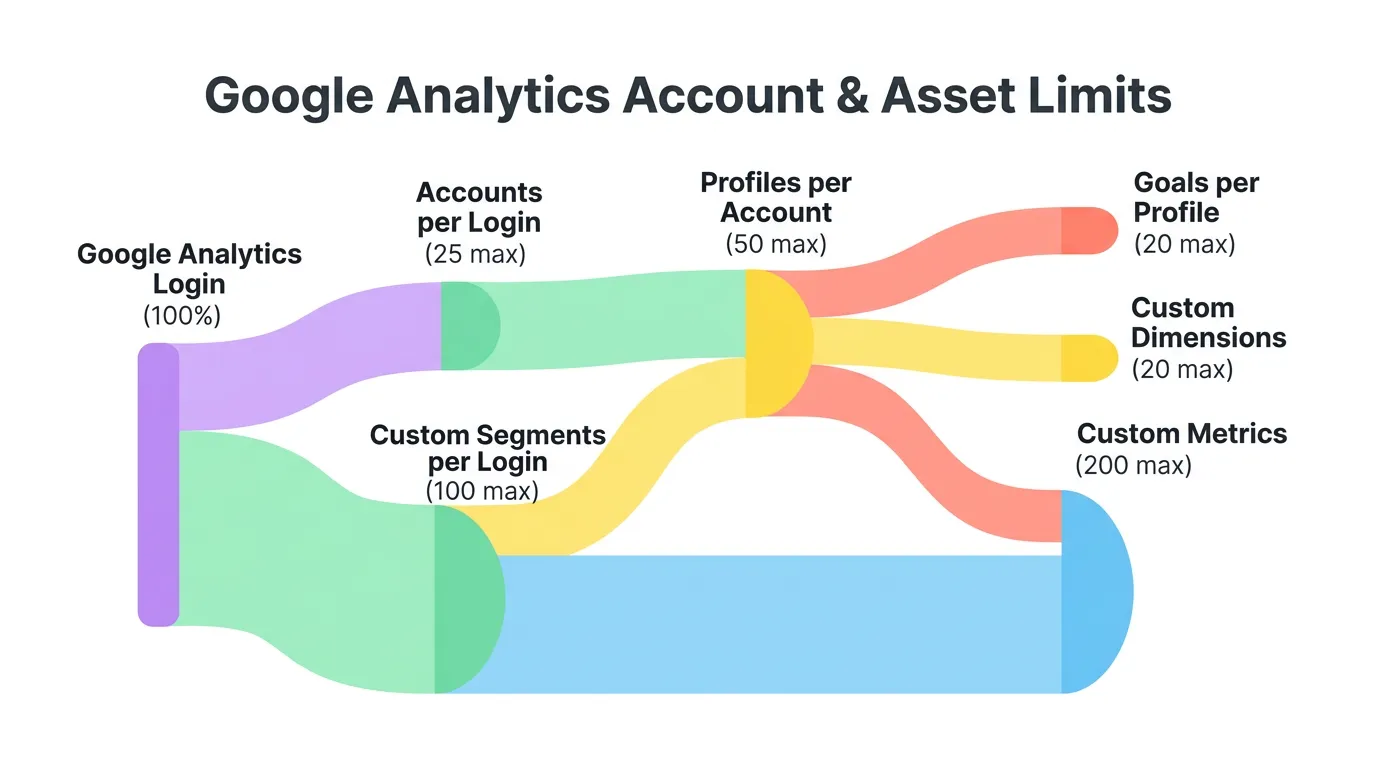
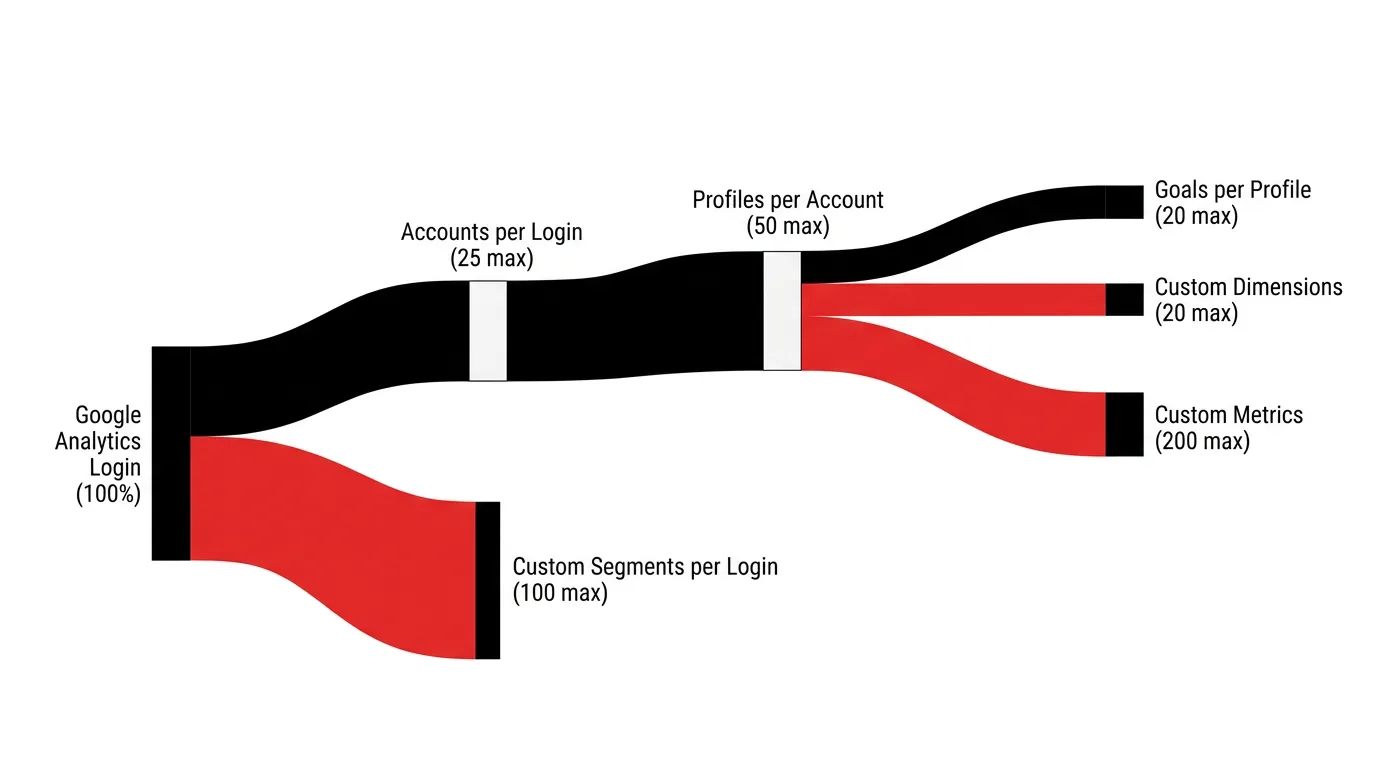
Switch colors, typography, and layout in one click—pick the style that fits your audience.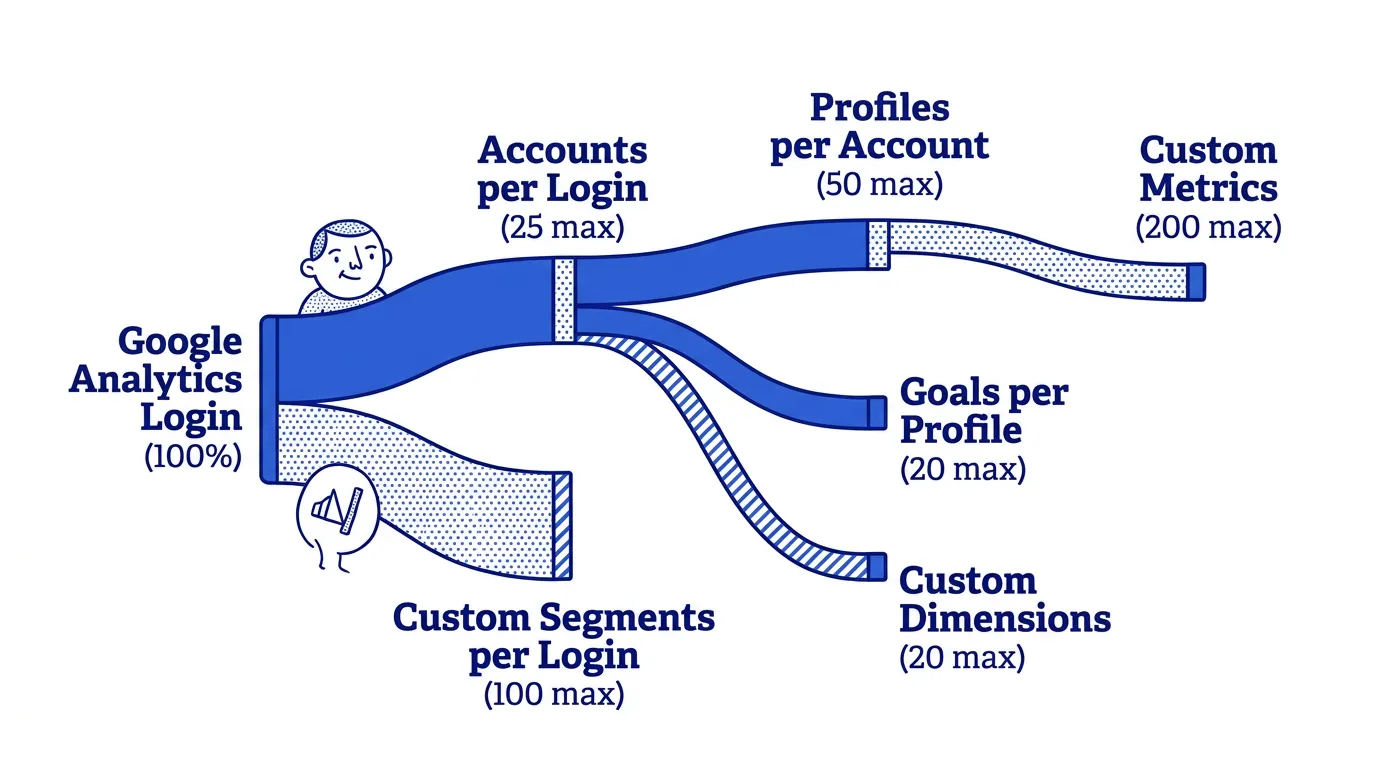
Explain, cite, and expand any section
Ask for an explanation, jump to sources, or turn a section into an infographic or flashcards—without rebuilding from scratch.Turn any section into an infographic
Use the Infographic action to generate a polished graphic from a section.Hear Your Visual Come Alive
One click turns a silent diagram into a guided walkthrough—AI narrates the story while you keep exploring every clickable part.How It Works
Use Sankey Flows Anywhere
Reports & Analysis
Replace dense tables with a proportional view of where value enters, splits, and exits.Websites & Articles
Embed clear Sankeys so readers can review complex systems instead of skimming numbers alone.Teaching & Workshops
Walk through flows live—open a branch, explain a split, and keep everyone aligned.Safe and secure
We never use your data to train our AI models, We never share your data with others, Your information always remains yours

Questions & Answers
An AI Sankey Flow generator turns text, tables, or documents into a directional flow diagram where path width is proportional to quantity—ideal for budgets, energy mixes, and pipelines.
Describe your flow or upload a source in the magic box. MyLens locks to the Sankey Flow visual, builds a Canvas diagram that follows the Sankey guide, and lets you edit it, use AI visual actions, and present it.
MyLens Sankeys include AI visual actions—not just a flat export. Use Explain, Cite, or Expand on the visual—and the layout follows a dedicated Sankey Flow guide for consistent structure.
Yes. Upload CSV or Excel files (or paste numbers) and MyLens extracts stages and quantities to form proportional paths.
Yes. Export from MyLens in formats such as PNG, PDF, and PowerPoint for reports and presentations to others.
Yes. MyLens lets you create Sankey Flows for free so you can try the full MyLens experience before upgrading.