Lovable vs MyLens AI: AI Tools for Visual Communication
Compare Lovable for building simple charts and dashboards with MyLens for generating complex clickable visuals and diagrams in seconds.
Lovable and MyLens both help you communicate your insights visually with others—but they shine at different levels of complexity. Lovable lets you build simple charts, dashboards, and presentation sites to share your work—with AI acting as your developer. For straightforward visuals, it works great. MyLens uses AI to generate clickable, interactive visuals directly from your existing content in seconds—purpose-built for the complex diagrams (multi-step flowcharts, long mind maps, citation-linked timelines) that would take hours to build from scratch.
If you’re choosing between them, it comes down to how you want to share what you know. Need a simple chart, dashboard, or presentation site? That’s Lovable. Have existing content and want AI to turn it into complex, explorable visuals like mind maps, timelines, and flowcharts you can share? That’s MyLens. This guide breaks down what each platform does, how they differ, and when to use which.
TL;DR
Lovable is an AI-powered no-code builder—you describe the visual you want to share—a chart, a dashboard, a presentation site—and it generates it on a modern stack (React, Supabase, Tailwind) with one-click publish. For simple visual formats like a chart page or a single-dashboard view, Lovable handles that well. But when you need complex interactive visuals—multi-step flowcharts, long clickable mind maps, timelines with dozens of events, or visuals where you can click any part to see the source citation—building those from scratch takes significant time and effort. That’s where MyLens shines: you bring in your documents, spreadsheets, videos, and URLs, and it generates these complex, clickable visuals in seconds—saving you hours of manual building—ready to explore and present.
Try Yourself
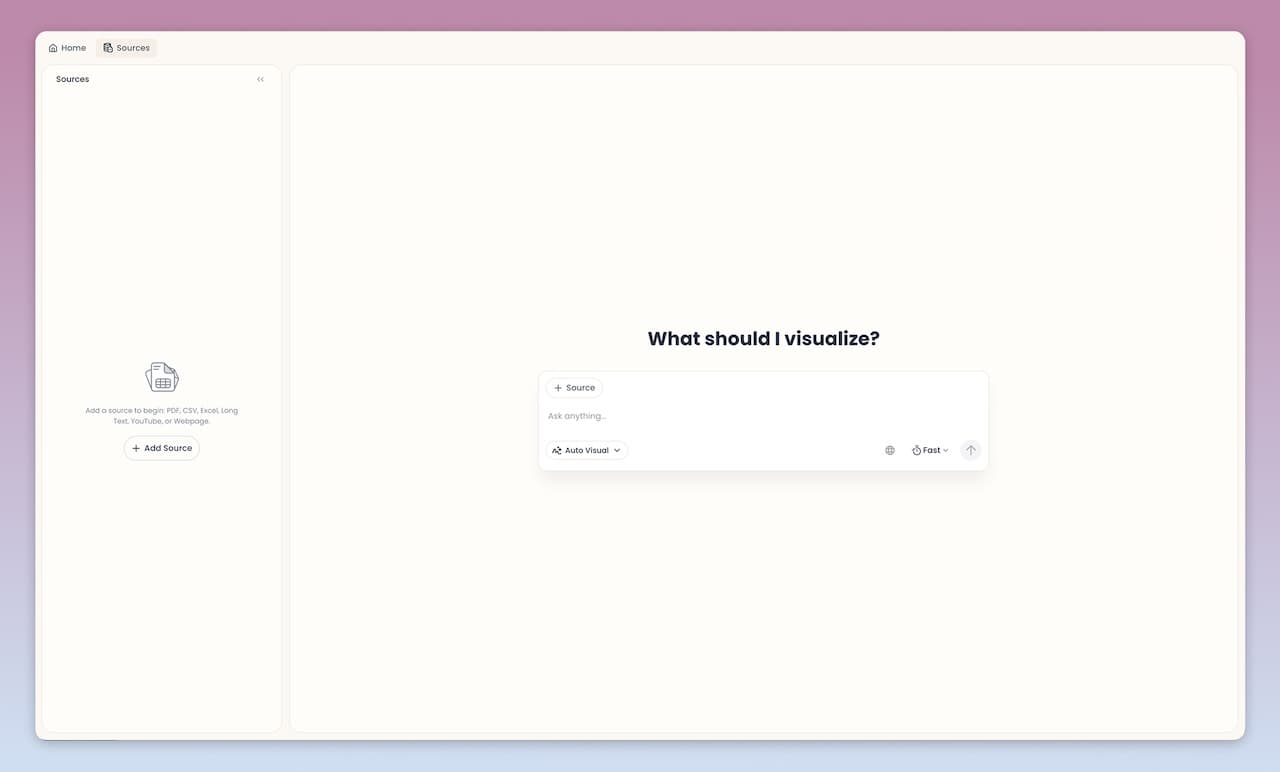
Want to try Lovable? Head over to lovable.dev to start building. Want to try MyLens? Give it a try right here for free — just type a topic or paste your content:
What Is Lovable?
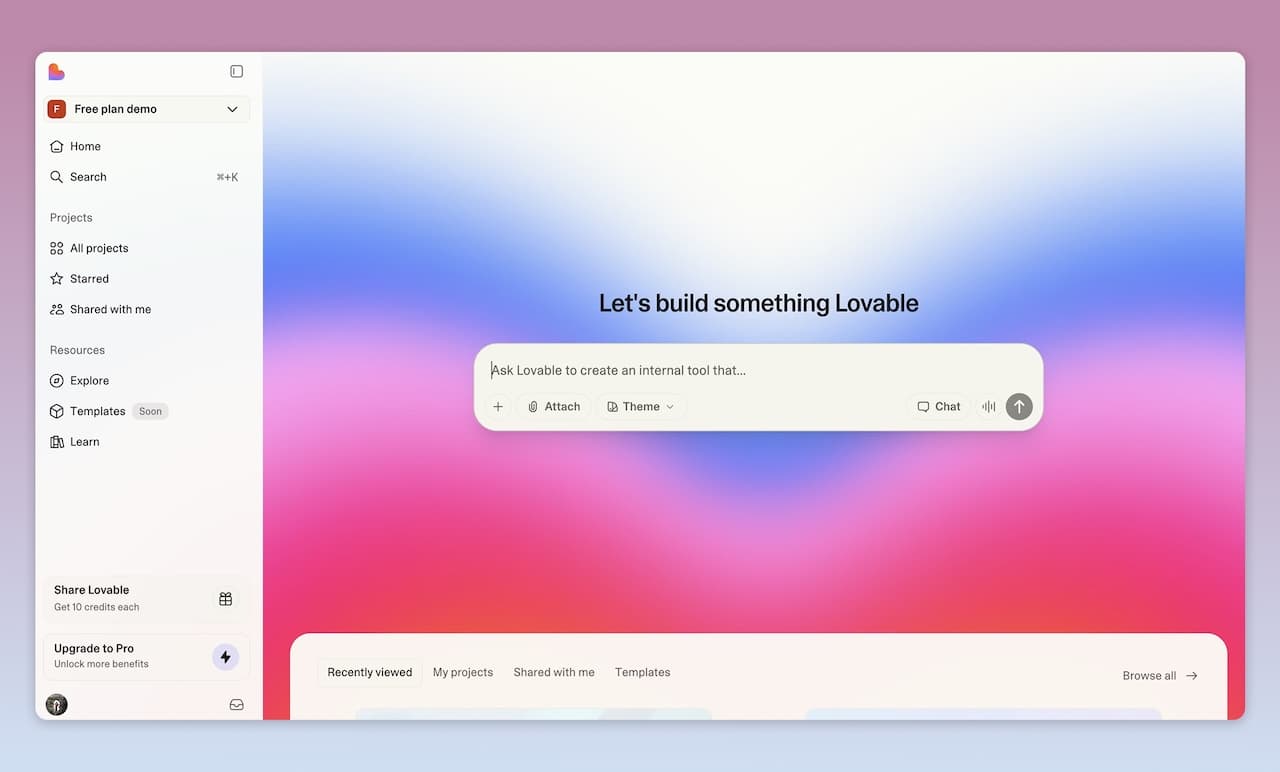
Lovable is an AI-powered no-code app and website builder. You describe what you want to build—an MVP, portal, internal dashboard, marketing site, or campaign experience—by chatting with an AI that behaves like a developer. You can paste Notion docs, share screenshots, or outline your idea in plain language; Lovable turns that into working software.
Under the hood, Lovable generates real code on a modern, standard stack: React, Supabase, and Tailwind. It provisions infrastructure like authentication, database, file storage, and real-time features, and lets you sync your project to GitHub from day one so you always own your code. You can switch between no-code editing and code mode, tweak layouts visually, and then publish to a custom domain with SEO and basic security handled for you.
Lovable positions itself as an AI cofounder and development team. It is built for founders, marketers, designers, and teams who want to ship production-grade products and experiences quickly without hiring a full engineering team, while still staying on a stack that developers can work with later.
Key Lovable Features
- Chat-to-build: Describe what you want in natural language (or from Notion docs and screenshots) and get working apps and websites
- Production stack: React, Supabase, and Tailwind under the hood, with GitHub sync so you own and control your code
- Built-in backend: Postgres database, authentication, file storage, and real-time features via Lovable Cloud and Supabase
- Integrations and automation: Connect to 400+ tools via n8n, use Stripe for payments, and plug into your existing SaaS stack
- Visual editing: Tweak layouts, colors, and copy with direct visual control while keeping underlying code clean
- One-click publish: Ship to a custom domain with SEO optimizations and basic security handled for you
- Use cases across roles: Founders, marketers, designers, and agencies building SaaS apps, portals, dashboards, landing pages, and client projects
- No-code and code together: Build without code, but drop into code mode whenever you or your team want deeper control
Lovable offers different plans and workflows for individual founders, marketing teams, designers, and agencies. For the latest details on pricing, limits, and deployment options, check Lovable directly.
What Is MyLens?
MyLens is a native AI visual thinking platform that transforms your existing sources and data into clickable, interactive visuals and diagrams. AI handles the heavy lifting automatically—analyzing your content, extracting key insights, choosing the right visual format, generating the diagram, and applying professional styling—so you go from raw content to a polished visual in seconds. The visuals are rich, interactive structures where you can ask AI to expand nodes, drill down into sections, get citations from sources, generate infographics of any parts, and even get visual explanations. MyLens is built for complex, in-depth content—long mind maps, detailed flowcharts, multi-level timelines—the kind of specialized interactive visuals that are hard to build and maintain well in a general-purpose app builder. You can also chat with the AI to refine anything—change the layout, add detail, restyle a section—and it updates your visual live, like having an AI data visualizer by your side. The result is a professional, beautiful visual you can share or present.
MyLens supports a wide range of inputs: PDFs, Word documents, PowerPoint files, URLs, YouTube videos, spreadsheets (CSV, Excel), images (including screenshots), and plain text. You can feed it meeting notes, reports, articles, or any content and ask for a timeline, mind map, quadrant, flowchart, table, or other visual format. The AI suggests the best visual type for your content and generates it automatically.
Key MyLens Features
- Interactive Visuals: Mind maps, timelines, flowcharts, quadrants, tables, trees, and more—designed for complex, in-depth content
- Chat to refine: Ask AI to change layouts, add detail, restyle sections, or restructure your visual—it updates live, like having an AI data visualizer by your side
- Click to explore: Expand nodes, drill down, get explanations, view citations from your sources
- Fully editable: Manually adjust content or ask AI to refine visuals as you explore
- Multi-format input: Documents, images, spreadsheets, web content, videos, and raw text
- Chrome extension: Turn webpages, dashboards, articles, and videos into visuals directly from your browser
- Multi-language support: Generate visuals in many languages, useful for global teams and audiences
- Presentation-ready: Visuals that are engaging to present live or share asynchronously
- Citation support: Trace every insight back to original files so you can trust and defend your conclusions
MyLens is valuable for professionals analyzing business files, students turning study materials into visual summaries, educators creating lesson plans, and teams or founders who want to quickly understand complex material before deciding what to build or communicate next.
Feature Comparison: Lovable vs MyLens AI
| Feature | Lovable | MyLens |
|---|---|---|
| Primary Focus | Build simple charts, dashboards, and presentation sites to communicate your insights with others | Turn existing sources into clickable, interactive visuals designed for complex data and content |
| How Outputs Are Created | You describe what you want by chatting with AI; Lovable generates the app or site and lets you refine it visually or in code | You upload or link sources; MyLens analyzes them and generates visuals like timelines, mind maps, and flowcharts you can refine |
| Input Types | Prompts, outlines, Notion docs, screenshots, and configuration inside the Lovable editor | Documents (PDF, Word, PowerPoint), URLs, YouTube videos, images, CSV/Excel, and plain text |
| Output Types | Live web apps, SaaS products, internal tools, dashboards, portals, landing pages, and campaign experiences | Interactive diagrams (timelines, mind maps, flowcharts, quadrants, tables, trees) and visual summaries of your sources |
| Interactivity | Interactive apps and experiences for end users; you edit layout and behavior via no-code + code | Interactive diagrams for understanding and communication; click to expand nodes, drill down, and see citations |
| Tech Stack & Ownership | React + Supabase + Tailwind with GitHub sync so you own your code and can extend it with developers | Visual layer on top of your content; focused on analysis and communication rather than hosting your core app |
| Best For | You need a simple chart, dashboard, or presentation site to share your insights quickly | You need complex interactive visuals (flowcharts, mind maps, timelines with citations) generated from your sources—not built from scratch |
Two Approaches to Visual Communication
Both tools help you communicate visually. The difference is the approach:
Lovable: Build Simple Charts and Dashboards to Share Your Insights
Lovable’s approach is building simple charts, dashboards, and presentation sites from scratch to communicate your insights. You chat with an AI that behaves like a developer, and it generates your visual on a production stack. For straightforward visuals like a chart page, a dashboard, or a presentation site, Lovable delivers a polished, shareable product you own and can extend.
MyLens: AI Generates Specialized Interactive Visuals from Your Content
MyLens’s approach is generating clickable, interactive visuals directly from your existing content. As a native AI platform, it handles everything automatically—analysis, insight extraction, visual generation, and styling—so you go from documents to a polished diagram in seconds. Where MyLens stands out is complexity and speed: multi-step flowcharts, long clickable mind maps, timelines with dozens of events, visuals where you click any part to see the source citation—the kind of interactive structures that would take hours to build from scratch, even with a no-code builder, but MyLens generates them almost instantly. And when you want changes, you just chat with the AI and it updates your visual live—like having an AI data visualizer by your side.
Pricing & Accessibility
Lovable offers plans for individual founders, teams, and enterprises that include hosting, infrastructure, and AI-assisted building. MyLens offers free ways to get started with interactive visuals, with paid plans for more capacity and features. For the latest details on pricing, limits, and capabilities, check Lovable and MyLens directly.