draw.io vs MyLens AI: Diagramming & Visual Tools Comparison
Compare draw.io and MyLens AI to understand manual diagramming with full control versus AI-generated interactive visuals from your content.
draw.io and MyLens both help you turn information into visual diagrams—but they take different approaches. draw.io gives you a powerful editor to design diagrams yourself with full control over every element and where files are stored. MyLens uses AI to generate clickable, interactive visuals from your existing documents, data, and web content.
If you’re choosing between them, it comes down to how you want to work. Want to draw and arrange everything yourself with precise control? That’s draw.io. Have a stack of content and want AI to turn it into a visual you can explore? That’s MyLens. This guide breaks down what each platform does, how they differ, and when to use which.
TL;DR
draw.io is a browser-based diagramming tool—you design diagrams manually with full control, store them wherever you want, and integrate with Confluence, Google Drive, and more. No account required. MyLens is an AI visual thinking platform—you bring in your documents, spreadsheets, videos, and URLs, and it generates clickable diagrams (timelines, mind maps, flowcharts, and more) you can explore and present. Both produce visual diagrams, but draw.io is for building them by hand while MyLens is for generating them from your content with AI.
Try Yourself
Want to try draw.io? Head over to drawio.com to start diagramming. Want to try MyLens? Give it a try right here for free — just type a topic or paste your content:
What Is draw.io?
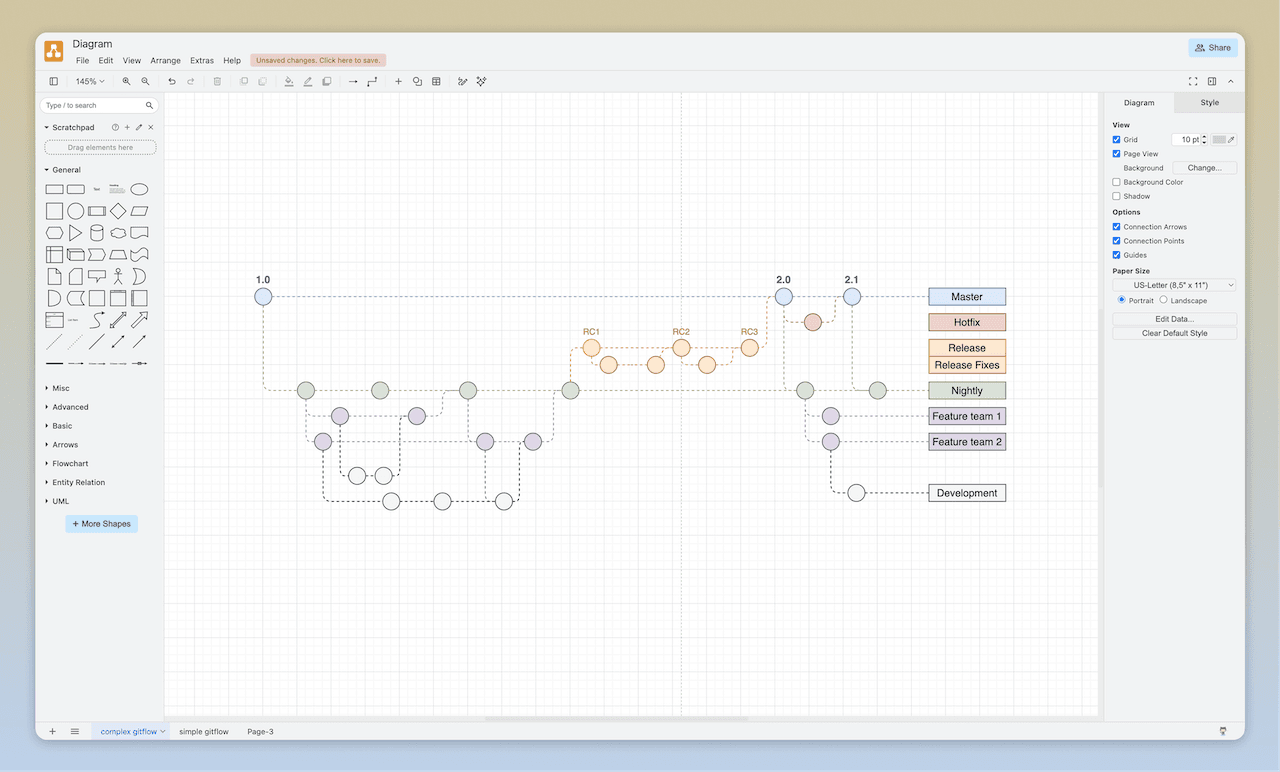
draw.io is a technology stack for building diagramming applications and one of the world's most widely used browser-based diagramming tools. Its mission is to provide free, high-quality diagramming software for everyone. You keep full control of your data: draw.io does not store your diagram data on its servers. You choose where to save—Google Drive, Microsoft OneDrive, Dropbox, GitHub, GitLab, in your browser, or on your device—and you can use the free online editor or the offline desktop app. No login or registration is required to start diagramming.
draw.io is built for manual (and assisted) diagram creation. You drag shapes from libraries, connect them, add labels, and style everything with a familiar editor. It supports a huge range of diagram types—from UML and flowcharts to org charts, mind maps, timelines, infographics, floorplans, and network diagrams—and you can generate diagrams from text descriptions (using OpenAI), Mermaid code, CSV data, or SQL. Real-time collaboration with shared cursors is available when using Google Drive, OneDrive, Dropbox, or draw.io in Confluence. The platform integrates deeply with Atlassian (Confluence, Jira), Google Workspace, Microsoft 365, Notion, and more.
Key draw.io Features
- Security-first: Your diagram data is not stored by draw.io; you control where it lives
- Store wherever you want: Google Drive, OneDrive, Dropbox, GitHub, GitLab, browser, or device
- No account needed: Start diagramming without login or registration
- Offline desktop app: Windows, macOS, and Linux for offline use
- Real-time collaboration: Shared cursors when using Drive, OneDrive, Dropbox, or Confluence
- Easy editor: Drag-and-drop shapes, connectors, labels, tables, swimlanes; shape libraries and templates
- Generate from text: Describe your diagram or use Mermaid, CSV, or SQL to generate diagrams
- Dark mode and themes: Diagram in dark mode or choose from editor themes
- Advanced tools: Infinite canvas, auto-layouts, layers, tags, metadata, custom shapes, HTML and math in labels
- Wide range of diagrams: UML, flowcharts, mind maps, timelines, infographics, org charts, floorplans, BPMN, and more
- Integrations: Confluence, Jira, Google Drive, OneDrive, Office 365, Teams, Notion, and embed in your own app
draw.io is free to use; commercial offerings exist in the Atlassian ecosystem (Confluence, Jira) while the core application and data remain under your control. Check draw.io's website for current details.
What Is MyLens?
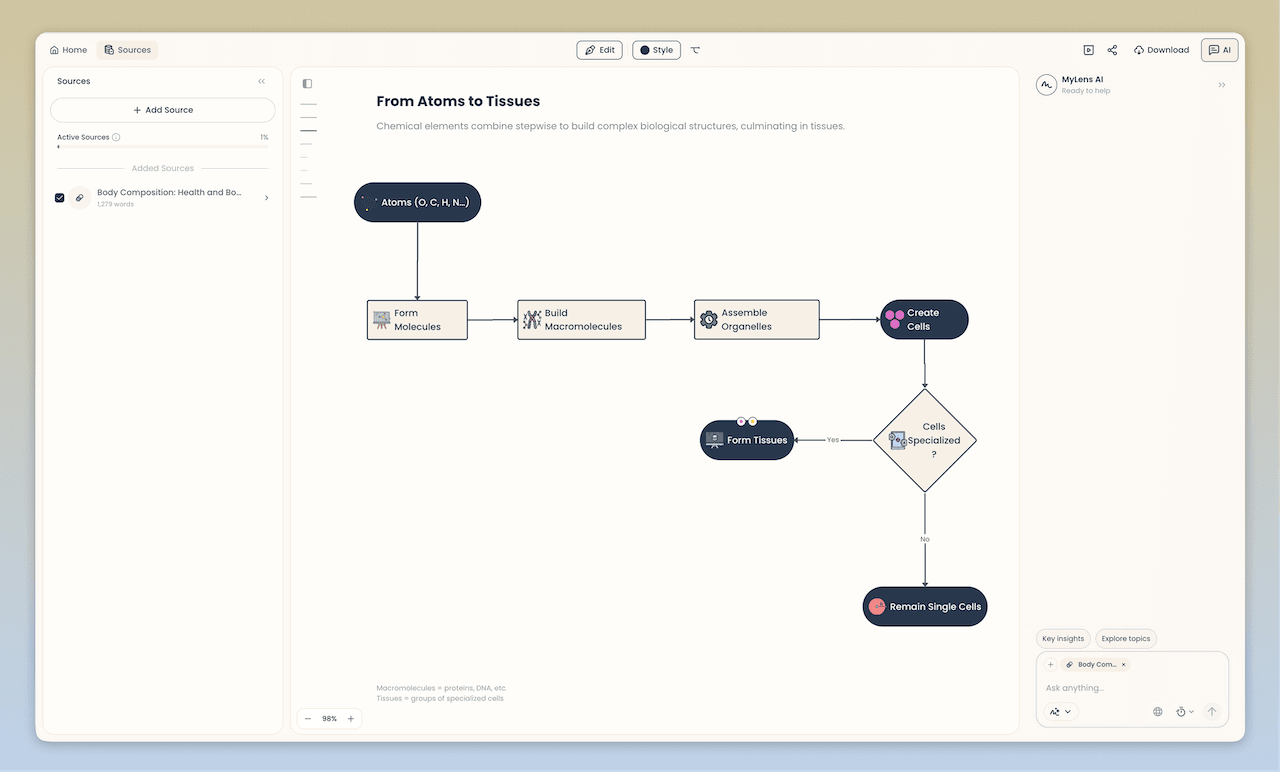
MyLens is an AI visual thinking platform that transforms your existing sources and data into clickable, interactive visuals and diagrams. Instead of reading through everything line by line, you see the structure visually and explore insights by interacting with the visual. The visuals are rich, interactive structures where you can ask AI to expand nodes, drill down into sections, get citations from sources, generate infographics of any parts, and even get visual explanations. MyLens is built for complex, in-depth content—long mind maps, detailed flowcharts, multi-level timelines—not just simple summaries. You explore interactively, adding more information to visual nodes until you fully grasp all insights. The result is a professional, beautiful visual you can share or present.
MyLens supports a wide range of inputs: PDFs, Word documents, PowerPoint files, URLs, YouTube videos, spreadsheets (CSV, Excel), images (including screenshots), and plain text. You can feed it meeting notes, reports, articles, or any content and ask for a timeline, mind map, quadrant, flowchart, table, or other visual format. The AI suggests the best visual type for your content and generates it automatically.
Key MyLens Features
- Interactive Visuals: Mind maps, timelines, flowcharts, quadrants, tables, trees, and more—designed for complex, in-depth content
- Click to Explore: Expand nodes, drill down, get explanations, view citations
- Fully Editable: Manually adjust content or ask AI to refine visuals
- Multi-format Input: Documents, images, spreadsheets, web content, videos, text
- Chrome Extension: Wherever you're on the web—YouTube, websites, docs—click MyLens to visualize content
- Multi-language Support: Generate visuals in any language
- Presentation-ready: Compelling visuals that are engaging to present or post
- Citation Support: View source evidence when files are uploaded
MyLens is valuable for professionals analyzing business files, students turning study materials into visual summaries, educators creating lesson plans, and content creators organizing information for presentations.
Feature Comparison: draw.io vs MyLens AI
| Feature | draw.io | MyLens |
|---|---|---|
| Primary Focus | Design diagrams yourself with full control over layout and storage | Turn existing sources into clickable visuals you can explore and present |
| How Visuals Are Created | You draw with shapes, templates, or generate from text/Mermaid/CSV/SQL | AI analyzes your content and generates the best visual type (timeline, mind map, etc.) |
| Input | Blank canvas, text description, Mermaid/CSV/SQL, or import of diagram files | Documents, URLs, videos, spreadsheets, images, and text |
| Interactivity | Drag-and-drop editing; no built-in click-to-expand or AI drill-down | Click to expand, drill down, get explanations, view citations, generate infographics |
| Storage & Security | You choose where diagrams live (Drive, OneDrive, Git, local); draw.io does not store your data | Content and visuals stored and processed in MyLens; share and present from the platform |
| Integrations | Confluence, Jira, Google Drive, OneDrive, Dropbox, GitHub, Notion, Office 365, Teams, desktop, VSCode | Chrome extension; web app |
| Diagram Types | Very broad: UML, flowcharts, mind maps, timelines, org charts, floorplans, BPMN, infographics, and more | Timelines, mind maps, flowcharts, tables, quadrants, trees, cards, and more (AI-suggested) |
| Best For | You need to draw and maintain diagrams with precise control and open storage | You have sources to make sense of and need to communicate insights visually |
| Multi-language Support | Yes (editor language and labels) | Yes |
When to Choose draw.io
Choose draw.io when you need a general-purpose diagramming tool with full control over every element and where your data is stored. It excels when you're creating software architecture diagrams, network infrastructure maps, process flows, UML diagrams, org charts, floorplans, BPMN models, mind maps, timelines, or infographics from scratch—or when you want to generate diagrams from Mermaid, CSV, or SQL and then edit them manually. It's also a strong fit when security and data ownership matter: your diagrams stay in your chosen storage, and draw.io doesn't lock your data behind an account or proprietary format.
- Creating and maintaining technical diagrams (UML, architecture, network, circuit, rack diagrams)
- Building process flows, swimlane flowcharts, and BPMN diagrams with precise control
- Designing org charts, floorplans, timelines, and infographics with shape libraries and templates
- Storing diagrams in Confluence, Jira, Google Drive, OneDrive, or Git for team access
- Collaborating in real time with shared cursors on diagrams in Drive, OneDrive, or Confluence
- Needing offline diagramming or embedding the editor in your own application
If your workflow is "I need to draw or generate a diagram and keep it in my own storage with my tools," draw.io is built for that.
When to Choose MyLens
Choose MyLens when you’d rather have AI do the diagramming for you. If you have existing content—documents, data, videos, or notes—and want to make sense of it visually, MyLens generates clickable visuals you can explore, refine, and present without building anything from scratch.
- Quickly transforming scattered sources (docs, data, videos, etc.) into professional visuals that highlight key points and relationships
- Understanding complex information at a glance through visual structures like timelines, mind maps, flowcharts, and tables
- Exploring interactively by clicking nodes to expand, drill down, get explanations, view citations, or generate infographics
- Discovering insights you might have missed and adding more information to visual nodes as you explore deeper
- Editing and personalizing visuals to make them yours, then present or share with your team or audience in different formats
If your workflow is “I have sources and I need to see what’s in them visually, explore, and share the result,” MyLens is built for that.
Key Differences: Two Approaches to Visual Diagrams
Both tools produce visual diagrams. The difference is the approach:
draw.io: Design Diagrams Yourself with Full Control
With draw.io, you build the diagram yourself. You drag shapes, connect them, style everything, and choose exactly where the file is stored. The approach is hands-on: you have full control over layout, structure, and format. draw.io integrates deeply with Confluence, Jira, Google Drive, and more, and your data stays where you put it—draw.io does not store it. This approach is ideal when you need precise, long-lived diagrams that anyone can open and edit.
MyLens: AI Generates Visuals from Your Content
With MyLens, AI does the diagramming. You bring in your sources and data, and the platform generates interactive visual structures—mind maps, timelines, flowcharts, tables, and more. The visuals are clickable: you expand nodes, drill down, get explanations, and view citations. MyLens is built for complex, in-depth content—detailed flowcharts, multi-level timelines, long mind maps—that would take significant effort to build manually. This approach is ideal when you want to understand what’s in your content and communicate insights visually without drawing a single shape.
Pricing & Accessibility
draw.io offers free, high-quality diagramming with no account required; you control where your data is stored. Commercial apps are available in the Atlassian ecosystem. MyLens offers free options to get started, with paid plans for more capacity and features. Check draw.io and MyLens for current details.
Related Articles
MyMap AI vs MyLens AI: AI Tools for Creating Diagrams
ComparisonsFebruary 19, 2026
Time.Graphics vs MyLens AI: Timeline Tools Comparison
ComparisonsFebruary 27, 2026